Newer, sleeker, faster and with more bells and whistles you could possibly handle. No, not the new Porsche 911 at the car show; this describes the latest version of our Click Stream SAP Portal analytical tool – Click Stream 2.3.
So what does the latest release of Click Stream 2.3 deliver? Increased performance, introduction of two great new reports, and an extended API (just to point out a few new features). Bottom line, we wanted to make gathering SAP Portal usage statistics easier than it has ever been before.
Here is a quick list of the new improvements to the Click Stream SAP Portal analyzing business package – with more in depth details below.
(But ultimately, the best way to discover these new features is to download the latest EPA today and use Click Stream in your SAP Portal. Only one way to find out…)
If your IT are like most, they are always under a time restraint of some sort. Also, what do you do when you want to control who sees what? These issues never end.
As an admin, you now have the power to open your subordinates reporting page, define the reports he needs (specific to his department – filter details, settings, layout, etc), then save this pre-configured report for easy recall later. We also made sure that you can still change and delete the pre-configured reports (read/write), whilst the subordinate can only view them (read only).
What does delegating reports allow? First, this new feature dramatically cuts down the time it takes to configure a report. Once saved, it not only locks in your details so no one can mess with your settings, but enables you and your subordinate easy access to that exact report and criteria the next time it needs to be recalled.
For example, your HR department only needs to see the top users in the last 3 months. The Finance department doesn’t need user information, but they need the top pages for the last quarter so they can do their quarterly numbers. With the multitude of filtering options, designing a report specific to each department’s requirements every time you need it can be time consuming and a bit overwhelming. In the new 2.3, compose a report and hit save. Then recall the same report anytime later.
Our team of developers continuously fine-tune, test and tweak our applications to increase performance. To improve Click Stream’s recording, we refined the recorder iView within the framework page and separated the JavaScript code into a dedicated cacheable file. These attention to details take data recording to the next level.
And to keep on top of the latest releases, Click Stream 2.3 now supports the AJAX framework, making it fully compatible with SAP NetWeaver Portal 7.3 & 7.0 EHP 2.

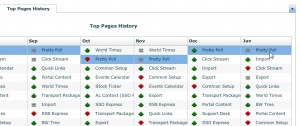
Top Pages History report. Month to month, easily compare the growth (or lack of) on a specific page.
The Top Pages History report simply gives you a quick access and swift reference to your top pages per specified month(s). Essentially its a movers and shakers report over and in each of the last 6 months. Easily determine growing pages, idle pages or pages with decreasing traffic?
And we have to say that this report will be the start of many more like it, so keep your eyes open!

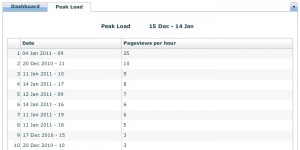
The Peak Load report displays the date and corresponding pageviews per hour in an easy to read table.
What tool do you use when you need to determine the sizing of your SAP Portal infrastructure? Is it convenient or a pain in the behind to get the numbers you need for the evaluation process? Do you have the time to do this on a regular and ongoing basis? And you have to account for your peak times of the month too?
With customer feedback on the inconvenience of this whole process, we developed a handy new report, the Peak Load Report. This helps your IT identify at a quick glance, the maximum number of concurrent users, logins, or pageviews per hour, minute, or even seconds. Once IT can establish the maximum load, then sizing your portal accordingly becomes a breeze. But you gotta get these numbers in the first place!
The Peak Load Report takes our Traffic Report one level deeper with exact hour, minute and second filtering criteria. When these reports are used in sync, determining exact traffic patterns has never been easier.
Doing an SAP Portal implementation? The new API features in Click Stream 2.3 work great for this. The previous version of the API provided access only to the top pages. With this latest version, you now have easy access to not only the number of active users, but the actual list of your active users.
Now your programmers have all the info they need within a handy API to get your SAP Portal implementation off to a great start.
The active users can also be filtered using Click Stream’s enhanced filtering feature to really drill down on specific communities. If for example your company has a forum, quickly access info on which role this forum/team/team role is assigned to. Also, determine not only the number of forum users, but who is currently online.
And finally, we introduced a convenient little end user iView – just like a scaled down, quick reference Click Stream. This handy tool can be for end users, budget decision makers, or both to immediately check their SAP Portal usage from a 10,000 foot view. This iView can be a perfect starting point to let you know if you should dig any deeper into gathering important stats on your portal usage (with the next step opening up your Click Stream app of course).
We deliver this out-of-the-box in the Click Stream EPA using the existing SAP Portal theme. Personalize it to show or hide numbers such as the current active users, the number of users yesterday and today, the number of pageviews yesterday and today, and the maximum pageviews and users per day over time.
If you currently use Click Stream in your SAP Portal, simply go to our downloads page and download the latest EPA.
If you would like to try Click Stream to see what it can do for you, visit our Try & Buy page for details. We offer the full version (not a limited functionality demo version) for you to test drive in your SAP Portal. There is only one way to find out!
Comments are closed.