Splunk: Review of a Clever Log Files Collecting Tool
- November 22, 2010
- No Comments
“Splunk is Like Google for Your Log Files”

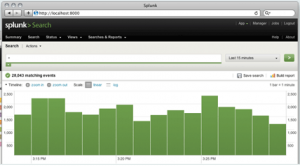
Splunk Screenshot
Do you find getting your log files a nightmare and collecting from multiple server nodes a long-winded process? Do you also not like to use the standard log viewer, especially when you always seem to miscalculate the amount of time and effort needed to format and analyze log files?
Our developers had a chance to play with a cool tool called, Splunk. Splunk greatly simplifies the vast majority of collecting log files into a database. Probably the greatest feature about Splunk is the search functionality – Splunk is to log files what Google is to websites. Does this sound too good to be true?
Well, we used Splunk in one of our servers and found it to be quite useful. Here is the scoop.
What is Splunk?
Basically, Splunk is software used to monitor, report and analyze live streaming IT data as well as terabytes of historical data – located on-premises or in the cloud. One can use Spunk to gain valuable insights from their IT data to improve service levels, reduce IT operations costs, lighten security risks, and drive new levels of operational visibility.
Head Developer Overview
From a practical point of view, here are a few key thoughts from our head developers. We dug a little deeper into what makes Splunk so great:
Installation and operation:
- Easy installation with just a hand full of clicks
- Runs on your own hardware and has an integrated webserver and database
- The tool collects log files into the database
- Using a webfrontend, you can access the database and search for log events similar as you search the web with Google
- Able to configure which log files are monitored
- Log files may be distributed to several servers across your landscape
- Lots of log formats are supported (e.g. SAP Portal and Sweetlets application logs)
- Splunk automatically recognizes the time of a log event
- The distribution of log events on the time axis is displayed as a column chart
- You can directly jump into the list of error messages of a single peak (one column of the timeline column char)
- You can filter your search results by datasource
- only logs with a certain file extension
- only files from a certain folder
- only files from a certain host
Use cases:
- Analyze log files across all server nodes of the portal
- Analyze several log files in one directory at one time
- Analyze certain predefined sets of Windows log files of your PC
- Configure sets of logfiles once and offer the search functionality to several users via the web front-end
- Identify the peak usage times of an application
Identify background activities of applications
- If you search for “error”, it shows you, if the “error” events are always happening or only at a certain time
- Helps you to count error events per hour across several log files
License:

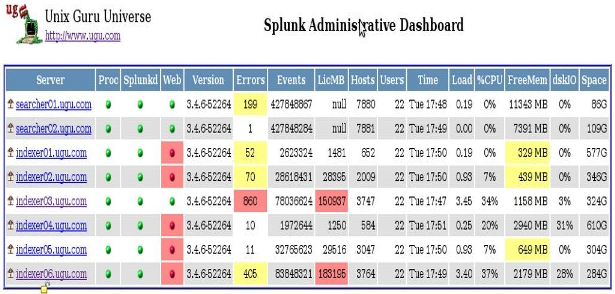
Splunk Dashboard
- The free version is restricted to 75 files and 500MB indexed data per day
- The enterprise version is required to get rid of these limitations and provides advanced features like custom dashboards.
- It starts at $6000 USD
How can Splunk help your business? For more information, check out Splunk at
for any questions on the above.